January 26, 2024
1 minute reading
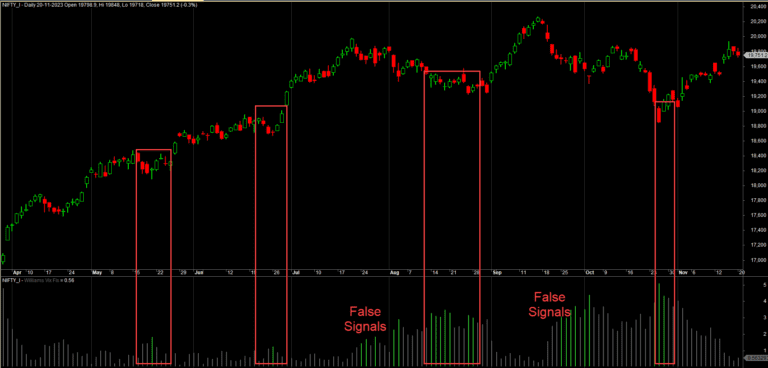
We thought about converting some of the top pinescript codes to Amibroker AFL code. So start with CM Williams VIX FIX with 51,000+ ratings for this indicator. CM Williams Vix Fix Indicator”, which includes the calculation of a Williams Vix Fix (WVF), a standard deviation and Bollinger Bands
Charts Nifty CM Williams VIX FIX

Tradingview Pinescript Code
study("CM_Williams_Vix_Fix", overlay=false)
pd = input(22, title="LookBack Period Standard Deviation High")
bbl = input(20, title="Bolinger Band Length")
mult = input(2.0    , minval=1, maxval=5, title="Bollinger Band Standard Devaition Up")
lb = input(50  , title="Look Back Period Percentile High")
ph = input(.85, title="Highest Percentile - 0.90=90%, 0.95=95%, 0.99=99%")
pl = input(1.01, title="Lowest Percentile - 1.10=90%, 1.05=95%, 1.01=99%")
hp = input(false, title="Show High Range - Based on Percentile and LookBack Period?")
sd = input(false, title="Show Standard Deviation Line?")

wvf = ((highest(close, pd)-low)/(highest(close, pd)))*100

sDev = mult * stdev(wvf, bbl)
midLine = sma(wvf, bbl)
lowerBand = midLine - sDev
upperBand = midLine + sDev

rangeHigh = (highest(wvf, lb)) * ph
rangeLow = (lowest(wvf, lb)) * pl


col = wvf >= upperBand or wvf >= rangeHigh ? lime : gray


plot(hp and rangeHigh ? rangeHigh : na, title="Range High Percentile", style=line, linewidth=4, color=orange)
plot(hp and rangeLow ? rangeLow : na, title="Range High Percentile", style=line, linewidth=4, color=orange)
plot(wvf, title="Williams Vix Fix", style=histogram, linewidth = 4, color=col)
plot(sd and upperBand ? upperBand : na, title="Upper Band", style=line, linewidth = 3, color=aqua)
Here is the Converted CM Williams VIX FIX Code – Amibroker AFL Code
//Coded by Rajandran R (Founder - Marketcalls)
//Website - www.marketcalls.in
//Date : 26th Jan 2024

_SECTION_BEGIN("CM_Williams_Vix_Fix");

// Input Parameters
pd = Param("LookBack Period Standard Deviation High", 22, 1, 100, 1);
bbl = Param("Bolinger Band Length", 20, 1, 100, 1);
mult = Param("Bollinger Band Standard Devaition Up", 2.0, 1, 5, 0.1);
lb = Param("Look Back Period Percentile High", 50, 1, 100, 1);
ph = Param("Highest Percentile", 0.85, 0.01, 0.99, 0.01);
pl = Param("Lowest Percentile", 1.01, 1.01, 1.10, 0.01);
hp = ParamToggle("Show High Range", "No|Yes", 0);
sd = ParamToggle("Show Standard Deviation Line", "No|Yes", 0);

// Williams Vix Fix calculation
wvf = ((HHV(C, pd) - L) / (HHV(C, pd))) * 100;

// Standard Deviation and Bollinger Bands
sDev = mult * StDev(wvf, bbl);
midLine = MA(wvf, bbl);
lowerBand = midLine - sDev;
upperBand = midLine + sDev;

// Range Calculation
rangeHigh = (HHV(wvf, lb)) * ph;
rangeLow = (LLV(wvf, lb)) * pl;

// Color Conditions
col = IIf(wvf >= upperBand OR wvf >= rangeHigh, colorLime, colorGrey40);

// Plotting
if(hp)
{
    Plot(rangeHigh, "Range High Percentile", colorOrange, styleLine | styleThick);
    Plot(rangeLow, "Range Low Percentile", colorOrange, styleLine | styleThick);
}

Plot(wvf, "Williams Vix Fix", col, styleHistogram | styleThick);

if(sd)
{
    Plot(upperBand, "Upper Band", colorAqua, styleLine | styleThick);
}

_SECTION_END();

