

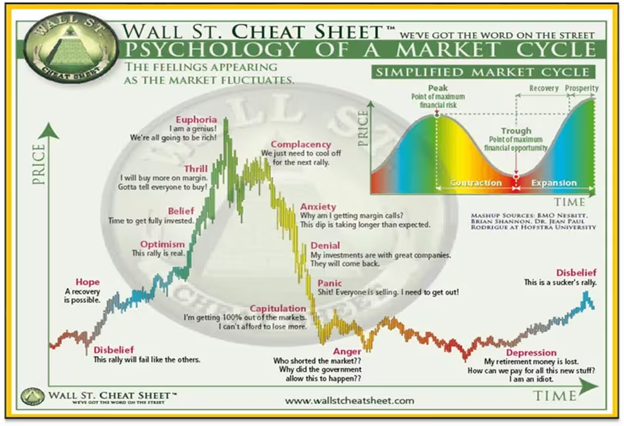
The “Wall Street Cheat Sheet” has been around forever. it is simply known by many different names.
It visually represents what drives every market everywhere: human psychology.
By understanding the nature of market psychology and how it affects market cycles, you can better prepare for them and make more informed investment decisions.
Below, we’ll go over each section of the Cheat Sheet, some of the main features, and possible ways to trade them.
Contents
First, let’s start with the End/Beginning of the cycle.
In the disbelief stage of the cycle, the market has experienced a sharp decline, often 20% or more (the classic definition of a bear market). At this stage, no one believes the market will recover and they are preparing for more pain.
This is where you buy dividend stocks and continue to earn average.
There is no bullish price in the markets and many offers can be made.
You can better position yourself for the next bull market in this situation.
The next stage of the cycle is hope when investors slowly realize that the investment winter is over.
Markets seem much more stable and price appreciation is more consistent here.
Similar to Disbelief, simply dollar cost averaging is the best trade here.
Buying fixed growth names is also good here if you have extra capital.
Prices are rising, but there is still terror.
This is the point in the cycle where the news narrative shifts.
This is typical of this stage, when all the interlocutors believe that the market has entered a new uptrend.
The difference between this and the later stages is also what preceded it.
To be in the bullish stage, the market must exit a bear market/crash and have been stagnant for some time.
Now is the time to add more capital to the markets in general.
Prices start to rise faster.
These two are lumped together because they often have interchangeable features.
In these two stages, the market is the right place. generates large profits compared to the more conservative investments that were popular during the last phases.
At this stage, the market will often dominate the news cycle and you will start to hear about people who have made amazing amounts of money and been far from the bottom.
This is the time in the cycle to become more aggressive.
By holding less cash and cash equivalents and staying mostly invested in indices and stocks.
This is the point where everything always wins.
Non-publicly traded companies will IPO and trade at crazy sales multiples, often without real earnings (think SPAC and WeWork craze).
This is where everyone will have a buying tip for you, and even people who have never shown interest will want to tell you what they’ve invested in.
This is the point to start the transition to cash/equivalents.
You always remain partially invested in the market, but at that point, take profits or buy protection using puts.
It’s okay to lose the rest of the move because the risk/reward is skewed against you.
This most likely happens after a market correction of more than 10%.
People will talk about the market “overheating” and how this correction and skewed energy is “constructive”, this is met with violent rallies that often give hope of a continued uptrend but are almost always met with more selling.
This is the point to sell and take profits and money out of the market if you haven’t already. this is the last stop before we start losing ground.
Again, these two are lumped together because they are often interchangeable.
Here, we broke the low made after the Euphoic top, and selling has started to intensify.
News is circulating about how the days are red and the Fed/Banks need to help stop it. This is where people start to experience “just one big drop” or “next buying opportunity” price action, especially those buying in the euphoric stage.
You should only return to dollar cost averaging using the profits from the later stages.
Again, these are all grouped together because they probably happen around the same time.
The average trader is now deep red in the account, the margin calls have probably started and they are angry and short sellers, the government and themselves (although they often do not know the latter).
The price action here is the most violent as everyone wants to be out of the market.
The savvy investor just continues to dollar cost average here.
Let those profits from the top go back to work.
This stage marks the end of the big sell-off, so some investors start raising funds even if it’s early.
The last stage of the cycle is when everyone says they will never invest again.
The late 2000s and early 2010s have these flavors.
People beat themselves up when they’ve lost huge sums of money and their retirement accounts look terrible.
Many are now sitting in cash, having closed at or near the bottom of the move.
This is the stage that every dollar cost average refers to. Because of the earlier panic, many active traders will miss buying at or around the bottom, so dollar cost averaging is really the best trade here.
Late accumulation of shares for when the market recovers.
Here’s a high-level breakdown of all the stages of the Wall Street Cheat Sheet.
While everyone is always thinking about how they work in big 2008 bubble and technology crashes, it is important to note that the same psychology is also at play in normal market swings.
It’s all about psychology and where you’re from.
Although it is almost impossible to catch the absolute bottom and the absolute top, having some idea of where we are in the cycle is useful for your investing and trading.
We hope you enjoyed this article on the Wall Street Cheat Sheet.
If you have any questions, please send an email or leave a comment below.
Trading Vault!
Disclaimer: The above information is about educational purposes only and should not be treated as investment advice. The strategy presented would not be suitable for investors who are not familiar with stock trading options. Any reader interested in this strategy should do their own research and seek advice from a licensed financial advisor.
